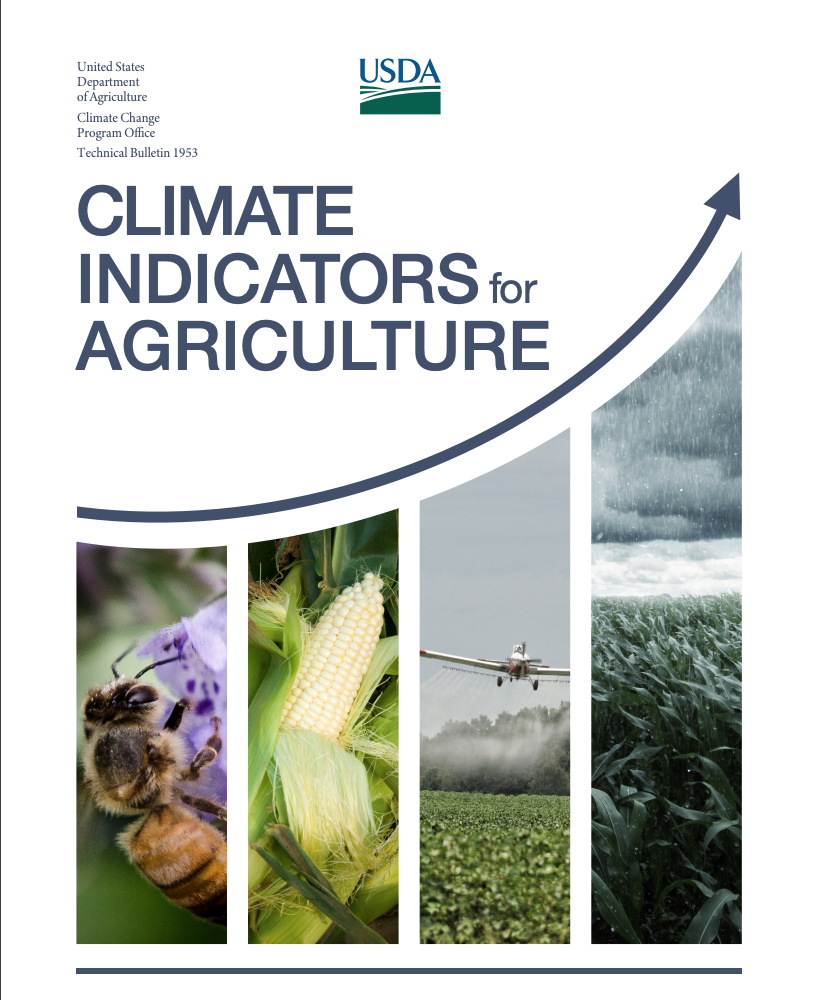
The report identifies 20 statistical indicators of climate change, in five categories, that will help agricultural professionals address regional needs. The categories are:
- Physical indicators – climate variables such as extreme precipitation, soil moisture, nighttime air temperature, heat waves and humidity, all of which have direct ties to agricultural production and food systems;
- Crop and livestock indicators – measuring factors such as animal heat stress and the ability to grow new crops in regions;
- Biological indicators – the range and infestation intensity of weeds, pests, disease vectors and pesticide use that affect crop production; and livestock management influenced by temperature, precipitation and atmospheric carbon dioxide concentrations;
- Phenological indicators – seasonal activities affected by climate conditions, such as flowering and pollination dates for a given crop; timing of budbreak in fruit trees; winter chill measurements; and insect generations per season; and
- Socioeconomic indicators – human and economic factors in agriculture such as crop insurance payments; net productivity; and the heat-related mortality of agricultural workers.
“The report was intended to appeal to a wide variety of audiences,” DeGaetano said. “We wanted to pick the indicators that were relevant to different agricultural sectors and sections around the country.”
DeGaetano is a faculty member in the Department of Earth and Atmospheric Sciences, which is jointly housed in the College of Engineering and the College of Agriculture and Life Sciences.
Co-authors included Peter Backlund, Colorado State University; Lawrence Buja, National Center for Atmospheric Research, Boulder, Colorado; Rachel Melnick, Agriculture and Food Systems Institute; Linda S. Prokopy, Purdue University; Eugene Takle, Iowa State University; and Margaret Walsh, Dennis Todey and Lewis Ziska, all with the USDA.

